Configuring High Availability
Introduction
Loadbalancer.org Endurance appliances can be deployed as a single node or multiple nodes working as an HA cluster.
| We always recommend deploying multiple nodes to avoid introducing a single point of failure. |
HA Concepts
When configured, nodes work in an Active-Passive manner. Here, the active node appliance handles all traffic under normal circumstances. If the active node fails, the passive node becomes active and handles all traffic.
Once configured, all services are automatically replicated between nodes. This ensures that should the Primary appliance fail, the Secondary is already configured to run the same services. Replication of the configured load balanced services from the Primary to the Secondary appliance occurs over the network using SSH/SCP.
HA clustering can be configured at any time. Once this is done, all load balanced services configured on the Primary are automatically replicated to the Secondary. Pairing must be performed on the appliance that is to be the Primary appliance.
HA Node Communication
By default, Pulse uses ucast on UDP port 6694 to communicate between the Primary and Secondary appliances. ??
To ensure that Pulse can function coorrectly, all nodes must be able to:
-
Perform an ICMP echo request (ping) to each other
-
Communicate with each other on TCP port 22
-
Communicate with each other on UDP port 6694
-
Communicate with each other on TCP port 9443
High Availability Configuration
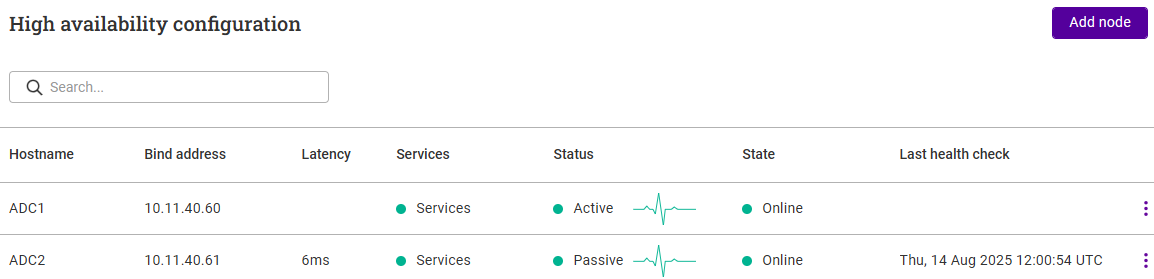
We recommend that 2 appliances are deployed in an HA configuration to provide a highly available and resilient load balancing solution. Once configured, the nodes operate in an active / passive manner. Each node in the cluster uses Pulse to determine the state of the peer node. Should the active node suffer a failure, the passive device will take over.
Once a second node has been added, load balanced services and other settings can be configured and modified on either node, the peer node will automatically be kept in sync.
Non-Replicated Settings/Actions
Some settings/actions are not replicated to the peer, these are listed by WebUI menu option in the table below:
| WebUI Main Menu Option | Sub Menu Option | Description |
|---|---|---|
Local Configuration |
All sub menu options |
Date & time settings, WebUI settings, various physical advanced settings, SNMP, licensing, Prometheus collector setting and ADC Portal related settings |
Network |
Interfaces |
Network interface settings |
Network |
IP Groups (Subnets) |
Network subnet settings |
Network |
Static IP |
Static IPs |
Maintenance |
Backup & Restore |
Creation of backups |
Maintenance |
Software Update |
Appliance software updates |
| Make sure that the items listed above are configured/actioned on each node. |
Configuring HA
-
Deploy a second appliance and Configure Initial Network Settings.
-
Using the WebUI on the first appliance, navigate to: Cluster Configuration > High-availability configuration.
-
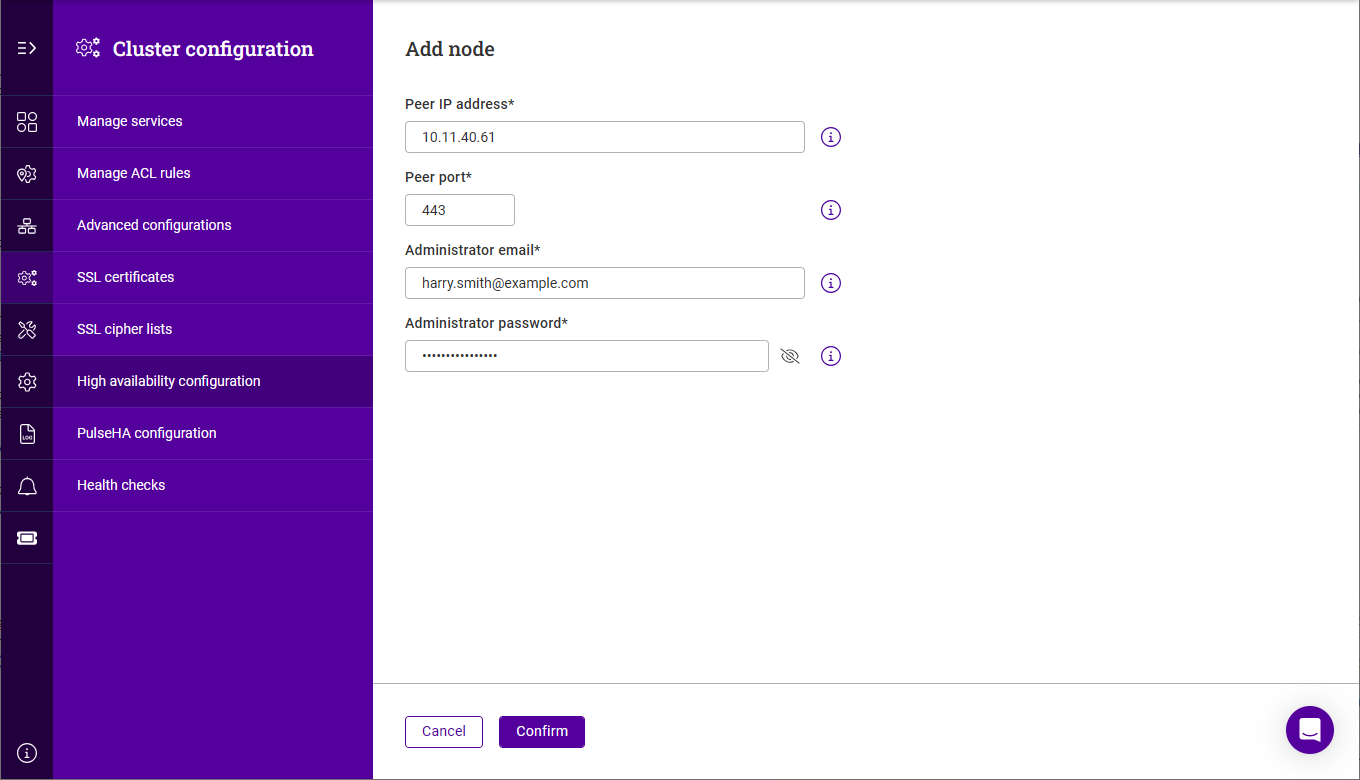
Click Add node.
-
Specify the Peer IP address, Administrator email and Administrator password for the second node.
-
Click Confirm and Confirm again in the popup to start the clustering process.
Auto Fail back
This option controls the cluster behavior when the Primary returns to service after a failure. With Automatic Fail-back enabled, the Primary will automatically return to active status, taking back the floating IP addresses from the Secondary. With Automatic Fail- back disabled, the Secondary will remain active and will retain the floating IP addresses. Fail-over back to the Primary must then be controlled manually.
Pulse Log
The log provides a useful insight into the health of an HA pair and can be viewed using the WebUI menu option: Logs > Heartbeat. The log can be searched using the search box at the top of the screen or can be downloaded for external analysis. The log can be refreshed using the Check Status button. The log file is located here: /var/log/ha.log.