Monitoring & Reporting
The Appliance
Resource Utilization Graphs
Utilization graphs are available for CPU, Memory, disks and connections.
All graphs can be viewed for the following periods: hourly, daily, weekly, monthly and yearly.
CPU
The CPU utilsation graph is displayed by default in the lower section of the System Overview. It can also be accessed by clicking on the view icon at the top right corner of the CPU widget.
"System Load Average" is used to show CPU utilisation. This is a very useful way to determine if the appliance is overloaded. To understand how to interpret the value, a bridge analogy can be used:
??? does graph show about 100% ???
-
A value of 0 means there’s no traffic on the bridge at all. In fact, between 0 and 1 means there’s no congestion, and an arriving car will just drive straight onto the bridge.
-
A value of 100% means the bridge is exactly at capacity. All is still good, but if traffic gets a little heavier, things are going to build up and getting accross the bridge will slow down.
-
A value over 100% means there’s congestion: A value of 2 means that there are two lanes of cars - 1 lane on the bridge and 1 lane waiting. A value of 3 means there are 3 lanes of cars - 1 lane on the bridge and two lanes waiting, etc.
Using a single core with the load average somewhere around 0.75 to 1 is great. Using a quad core with the load average somewhere around 3.0 - 4.0 would also be fine.
Memory
The memory utilsation graph is displayed by default in the lower section of the System Overview. It can also be accessed by clicking on the view icon at the top right corner of the MEMORY widget.
Load Balanced Services
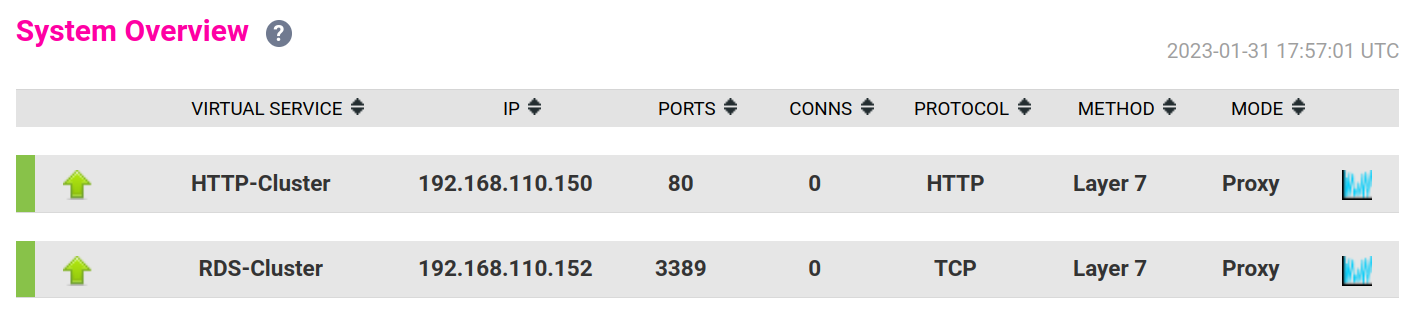
The System Overview includes a visual display indicating the health status of all Virtual and Real Servers as shown in the example below:
Clicking on each Virtual Service expands the view so that the associated Real Servers can also be seen:
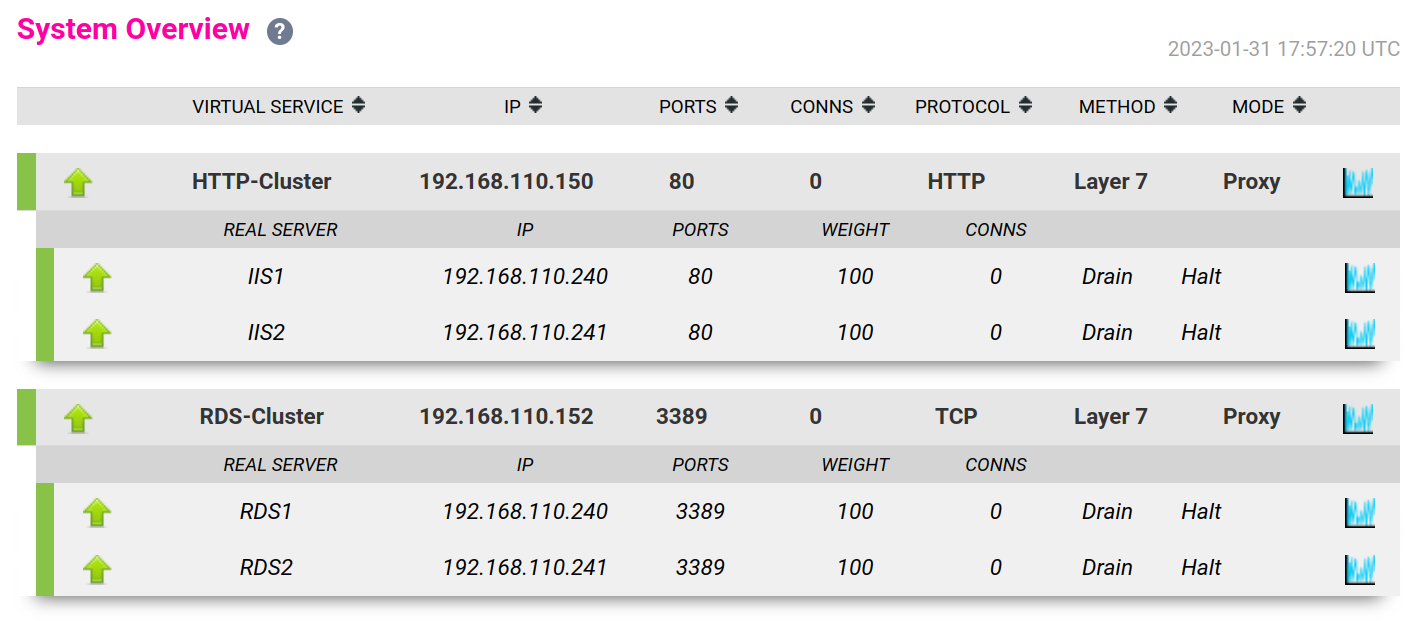
The various colors used to indicate status are:
-
Green - All Real Servers in the cluster are healthy
-
Yellow - One or more Real Servers in the cluster has failed or has been taken offline using Halt or Drain
-
Red - All Real Servers in the cluster have failed
-
Blue - All Real Servers have been taken offline using Drain or Halt (see below)
-
Purple/Green - Used to indicate that a particular VIP is used for HTTP to HTTPS redirection
Real Server Control
The System Overview also enables each Real Server to be taken offline. This can be achieved in two ways:
-
Drain - This option allows all existing connections to complete & close gracefully. It also prevents any new connections being established.
-
Halt - This option drops all existing connections immediately without waiting. It also prevents any new connections being established.
| Halting or draining all Real Servers in a cluster activates the fallback server. |
Logs
Endurance provides comprehensive logs accross all system functionality. This can be very useful when diagnosing issues.
To view logs:
-
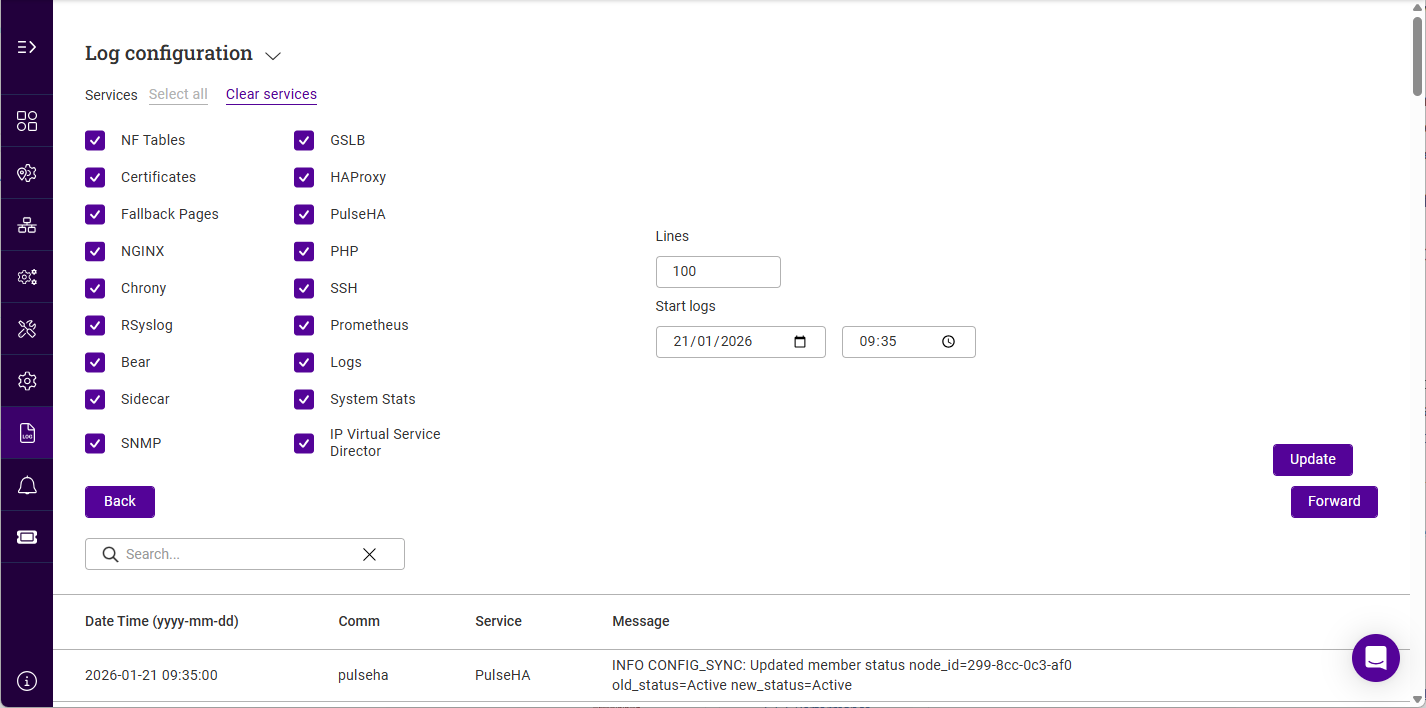
Using the WebUI, navigate to Logs
-
By default all logs are dispayed.
-
Use the checkboxes to select which log(s) you’d like to view.
-
Click Update to view the selected logs.
-
Use the Back and Forward buttons to view throught the log(s).
SNMP Reporting
By default SNMP is disabled. For information on enabling SNMP and configuring basic SNMP settings, see SNMP Configuration.