Logs
The appliance aggregates the log output from all of its system and load balancing services into a single, searchable interface. These logs are useful for monitoring the appliance and for diagnosing configuration or network issues. For more information on using the logs when troubleshooting, see Diagnostics & Troubleshooting.
The Logs menu provides three pages:
| Page | Description |
|---|---|
View, filter and search the log output produced by the appliance’s services. |
|
Control how much log data is stored on the appliance before it is rotated. |
|
Forward the appliance’s logs to one or more remote log servers. |
Services Logs
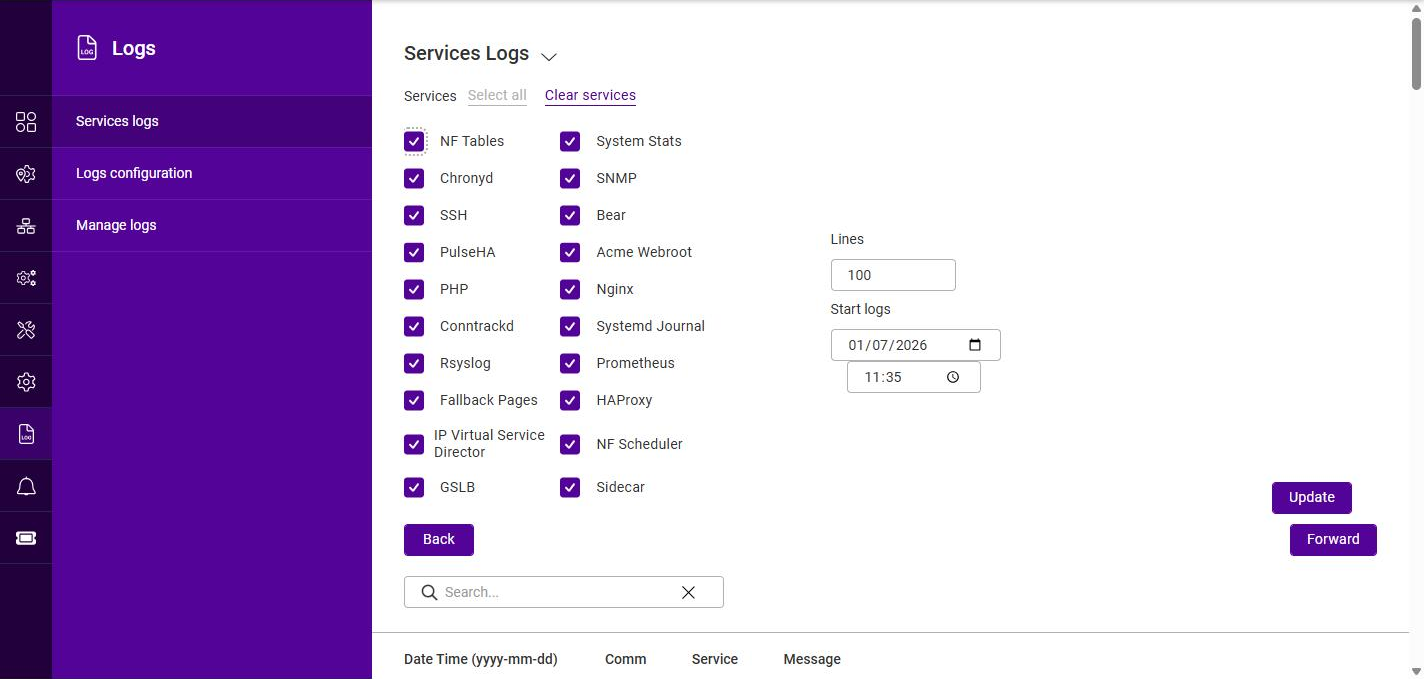
The Services logs page displays the log entries generated by the appliance’s services. The services to include, the number of lines to retrieve and the point in time to start from can all be specified, and the results can be searched.
-
Using the WebUI, navigate to Logs > Services logs.
-
Under Services, select (check) the service(s) whose log entries should be displayed. Click Select all to select every service, or Clear services to deselect all of them. The available services are:
Service Description NF Tables
The appliance firewall (nftables).
System Stats
Collection of system resource statistics.
Chronyd
The NTP time synchronization service. See System date & time.
SNMP
The SNMP agent. See SNMP Configuration.
SSH
The SSH daemon.
Bear
Internal appliance management service.
PulseHA
The high availability (clustering) service. See High Availability Configuration.
Acme Webroot
The ACME service used for automated (Let’s Encrypt) certificate issuance and renewal.
PHP
The PHP service used by the WebUI / API backend.
Nginx
The web server that serves the WebUI and API.
Conntrackd
The connection tracking daemon (used to synchronize connection state between cluster nodes).
Systemd Journal
The systemd journal (the underlying system log).
Rsyslog
The system logging service.
Prometheus
The Prometheus metrics exporter. See Prometheus.
Fallback Pages
The service that serves internal fallback pages. See Fallback pages.
HAProxy
The Layer 7 load balancing service. See Layer 7 Services.
IP Virtual Service Director
The Layer 4 load balancing service. See Layer 4 Services.
NF Scheduler
The firewall scheduling service.
GSLB
The Global Server Load Balancing service.
Sidecar
Internal appliance service.
-
In the Lines field, specify the maximum number of log lines to retrieve (the default is 100).
-
Under Start logs, select the Date and Time from which log entries should be displayed.
-
Click Update to retrieve the log entries matching the current selections. The entries are listed in the table at the bottom of the page:
Column Description Date Time (yyyy-mm-dd)
The date and time the entry was logged.
Comm
The command (process) that generated the entry.
Service
The service the entry relates to.
Message
The log message text.
-
Use the Back and Forward buttons to page backwards and forwards through the log history relative to the currently displayed entries.
-
To locate specific entries, type into the Search box to filter the displayed results. Click the X to clear the search.
| By default, the Layer 7 (HAProxy) service logs service state, restarts, reloads and health checks only. To log errors or individual connections, increase the logging level using the Enable logging option under Cluster Configuration > Layer 7 - Advanced configuration. Note that logging every connection on a busy Virtual Service is likely to rapidly exhaust the available log space. |
Logs Configuration
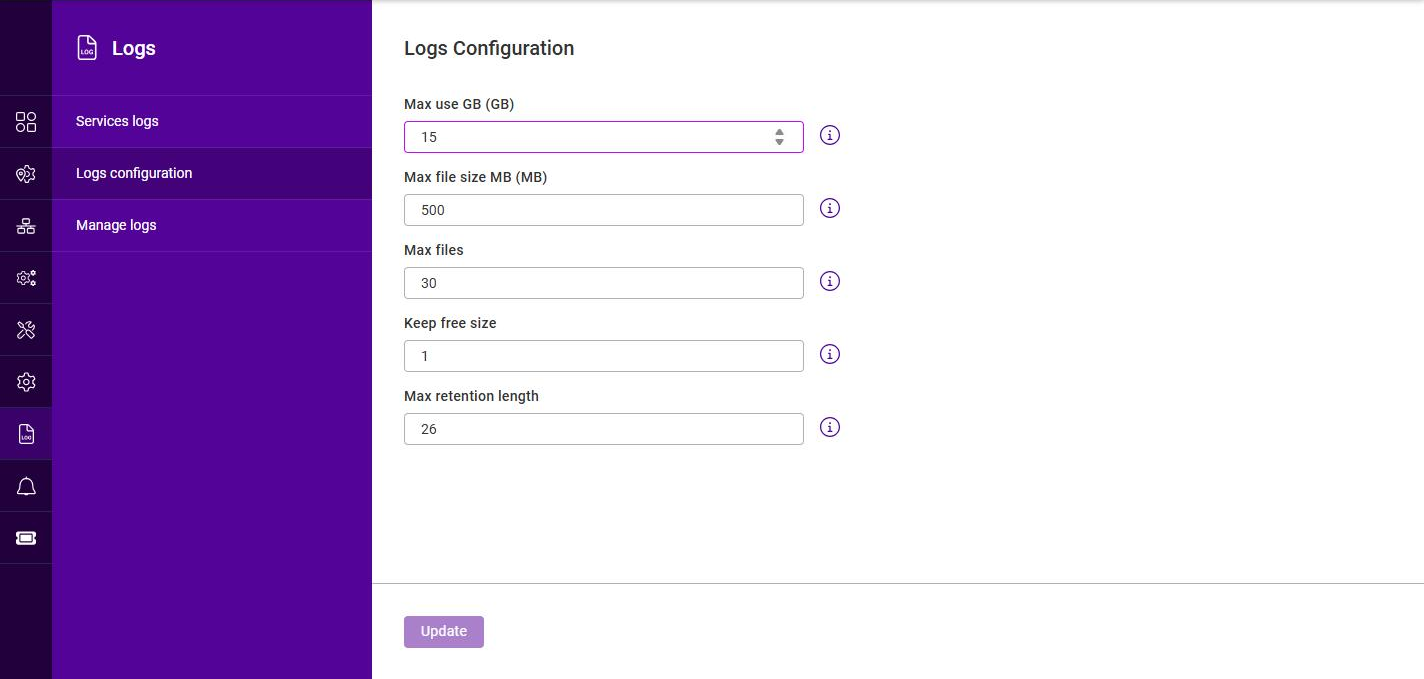
The Logs configuration page controls how much log data is retained on the appliance. When any of the configured limits is reached, the oldest log data is automatically rotated (removed) to stay within the limits.
To configure the log retention settings:
-
Using the WebUI, navigate to Logs > Logs configuration.
-
Configure the settings as required:
Setting Description Max use GB (GB)
The maximum amount of disk space, in GB, that the logs may use. The default is 15.
Max file size MB (MB)
The maximum size, in MB, of an individual log file before it is rotated. The default is 500.
Max files
The maximum number of individual log files to retain. The default is 30.
Keep free size
The amount of disk space, in GB, to keep free. Log data is rotated to ensure at least this much free space remains. The default is 1.
Max retention length
The maximum length of time, in weeks, to retain log data. The default is 26.
-
Click Update.
Manage Logs
Logs generated on the appliance can be forwarded to one or more remote log servers, for example for central collection, long-term archival or analysis. Two types of remote destination can be configured, each on its own tab:
-
Journals - forwards the systemd journal to a remote collector over HTTP or HTTPS.
-
Syslogs - forwards logs to a remote syslog server over TCP or UDP.
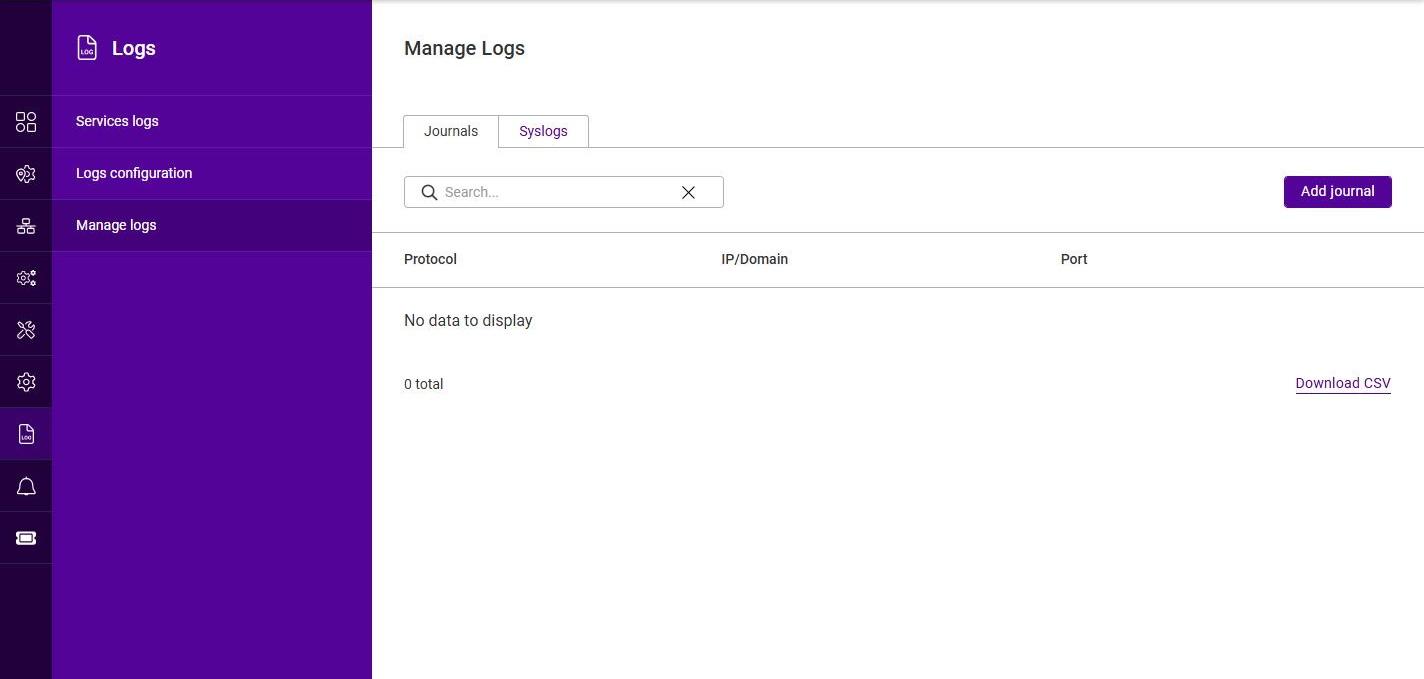
Each tab lists the configured destinations, showing the Protocol, IP/Domain and Port for each. The list can be filtered using the Search box and exported using the Download CSV link.
Journals
To add a journal (HTTP/HTTPS) destination:
-
Using the WebUI, navigate to Logs > Manage logs and select the Journals tab.
-
Click Add journal.
-
Select the Protocol, either HTTP or HTTPS.
-
Specify the IP/Domain of the remote server. An IP address or FQDN can be used.
-
Specify the Port that the remote server listens on.
-
Click Submit.
Syslogs
To add a syslog (TCP/UDP) destination:
-
Using the WebUI, navigate to Logs > Manage logs and select the Syslogs tab.
-
Click Add syslog.
-
Select the Protocol, either TCP or UDP.
-
Specify the IP/Domain of the remote syslog server. An IP address or FQDN can be used.
-
Specify the Port that the remote syslog server listens on.
-
Click Submit.
To modify or delete a remote destination:
-
On the relevant tab, click the three dots menu next to the destination.
-
Click Edit to change its settings, or click Delete then Confirm to remove it.