System Overview
The System Overview is the appliance dashboard and is the first page displayed after logging in to the WebUI. It presents a real-time, at-a-glance summary of the appliance’s health and status through a set of widgets, and provides drill-down access to detailed historical performance graphs.
To display the System Overview:
-
Using the WebUI, navigate to System overview.
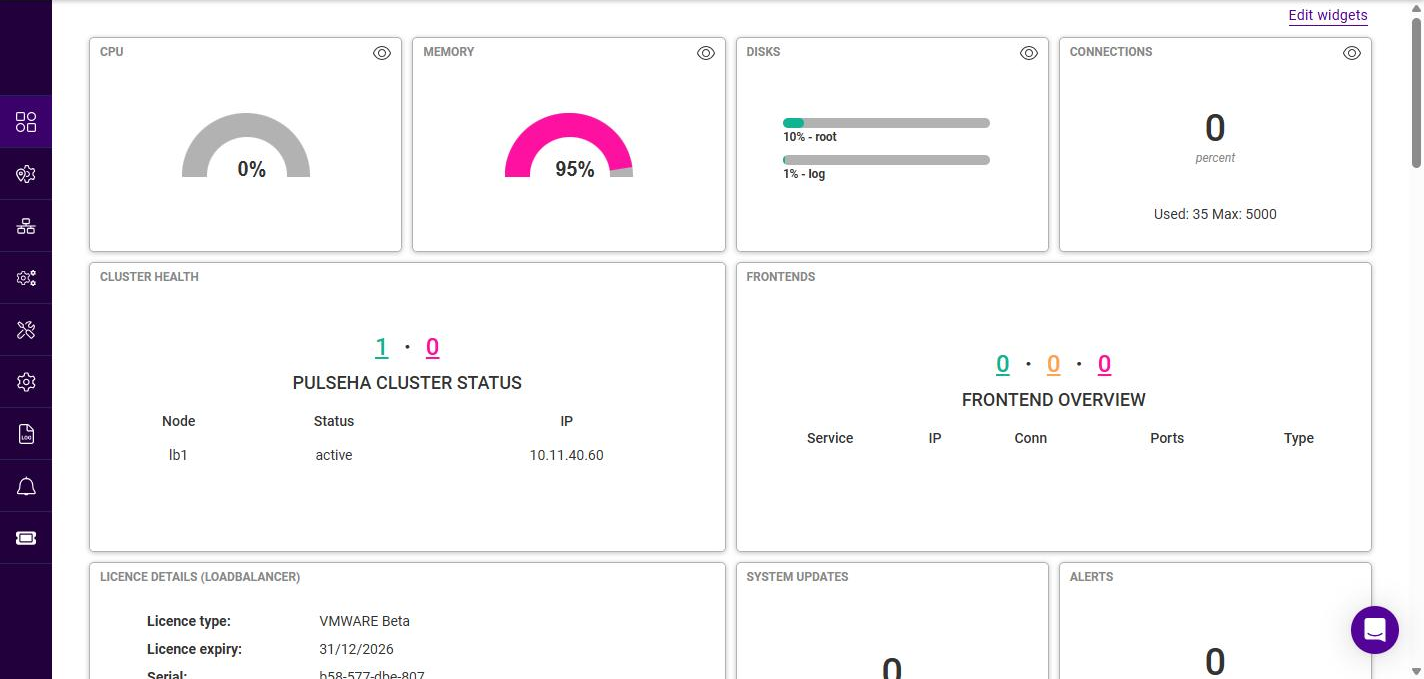
The dashboard is fully customizable - individual widgets can be moved, resized, added and removed as described in Customizing the Dashboard.
Dashboard Widgets
Each widget presents a specific aspect of the appliance’s status. The available widgets are described in the table below.
| Widget | Description |
|---|---|
CPU |
A gauge showing current CPU utilization as a percentage. |
Memory |
A gauge showing current memory (RAM) utilization as a percentage. |
Disks |
Horizontal bars showing the percentage of disk space used on each partition, e.g. root and log. |
Connections |
The current number of connections expressed as a percentage of the configured maximum, together with the number of connections currently in use and the maximum permitted, e.g. Used: 35 Max: 5000. |
Cluster Health |
Displays the PulseHA Cluster Status - a count of healthy (green) and failed (red) nodes, followed by a table listing each Node, its Status (e.g. active) and its IP address. For more information on HA clustering, see High Availability Configuration. |
Frontends |
Displays the Frontend Overview - a count of the configured frontends grouped by health status (green / amber / red), followed by a table listing each Service, IP address, current number of connections (Conn), Ports and Type (Layer 4 or Layer 7). |
Licence Details (Loadbalancer) |
Shows the appliance licence information, including the Licence type, Licence expiry date, Serial number and the status of Core updates and Security updates (whether licensed, and the applicable expiry). |
System Updates |
The number of system updates currently available for the appliance. |
Alerts |
The number of active alerts. |
Network Graph (kbs) |
A real-time line graph of network throughput in kb/s, showing the transmit (tx) and receive (rx) rate for each interface. |
System Load Average (%) |
A line graph of the system load average over time. |
System Memory Usage (Mb) |
A line graph of memory usage in Mb over time. |
| The status counts shown in the Cluster Health and Frontends widgets are links - click a count to jump to the relevant page for more detail. |
Viewing Detailed Metrics
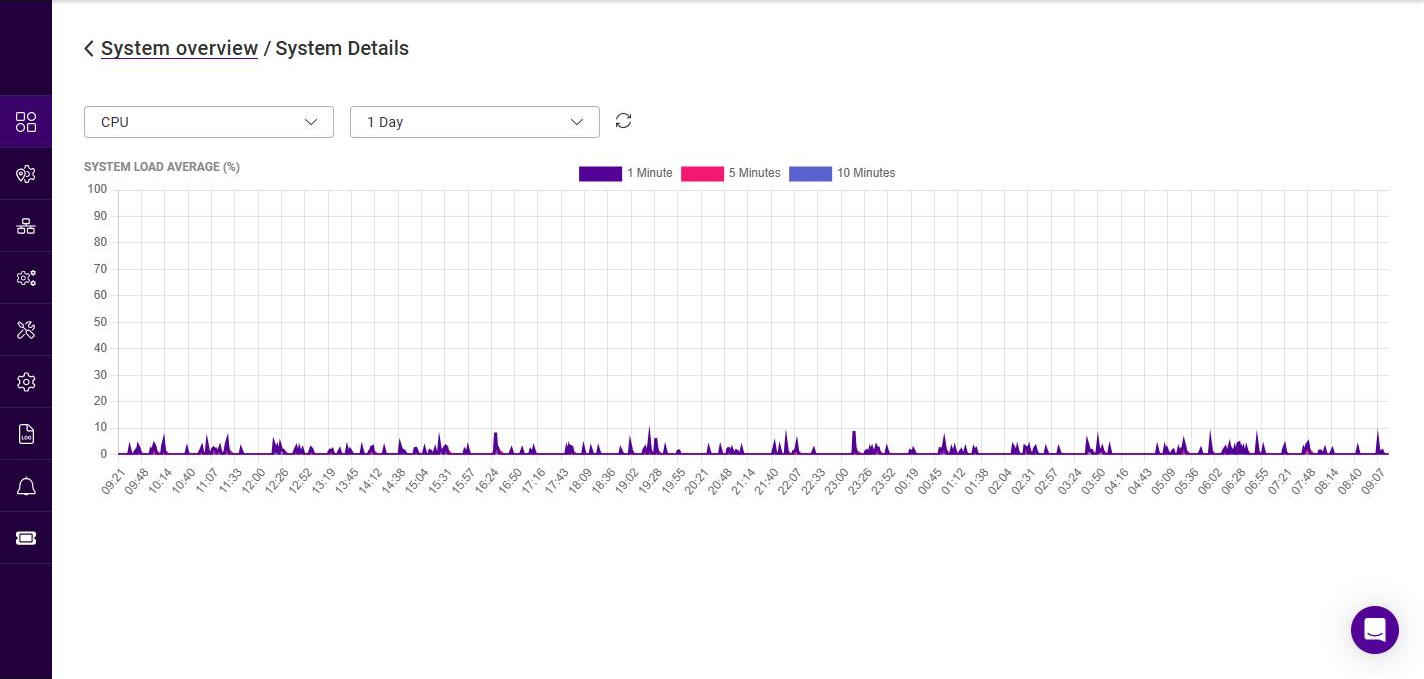
The resource and graph widgets (CPU, Memory, Disks, Connections and the graph widgets) include an eye icon in their top-right corner. Clicking this icon opens the System Details view, which displays a larger, historical graph for the selected metric.
-
On the required widget, click the eye icon.
-
Select the metric to display from the first drop-down, the options are:
Metric Description CPU
CPU utilization and system load average.
Memory
Memory (RAM) utilization.
Disks
Disk space usage per partition.
Interfaces
Per-interface throughput.
Network
Overall network throughput.
Connections
Connection counts.
System Load Average (%)
The system load average.
-
Select the time period to display from the second drop-down. The options are 1 Hour, 1 Day, 1 Week, 1 Month and 1 Year.
-
Click the refresh icon to reload the graph with the latest data.
-
To return to the dashboard, click the System overview breadcrumb.
Customizing the Dashboard
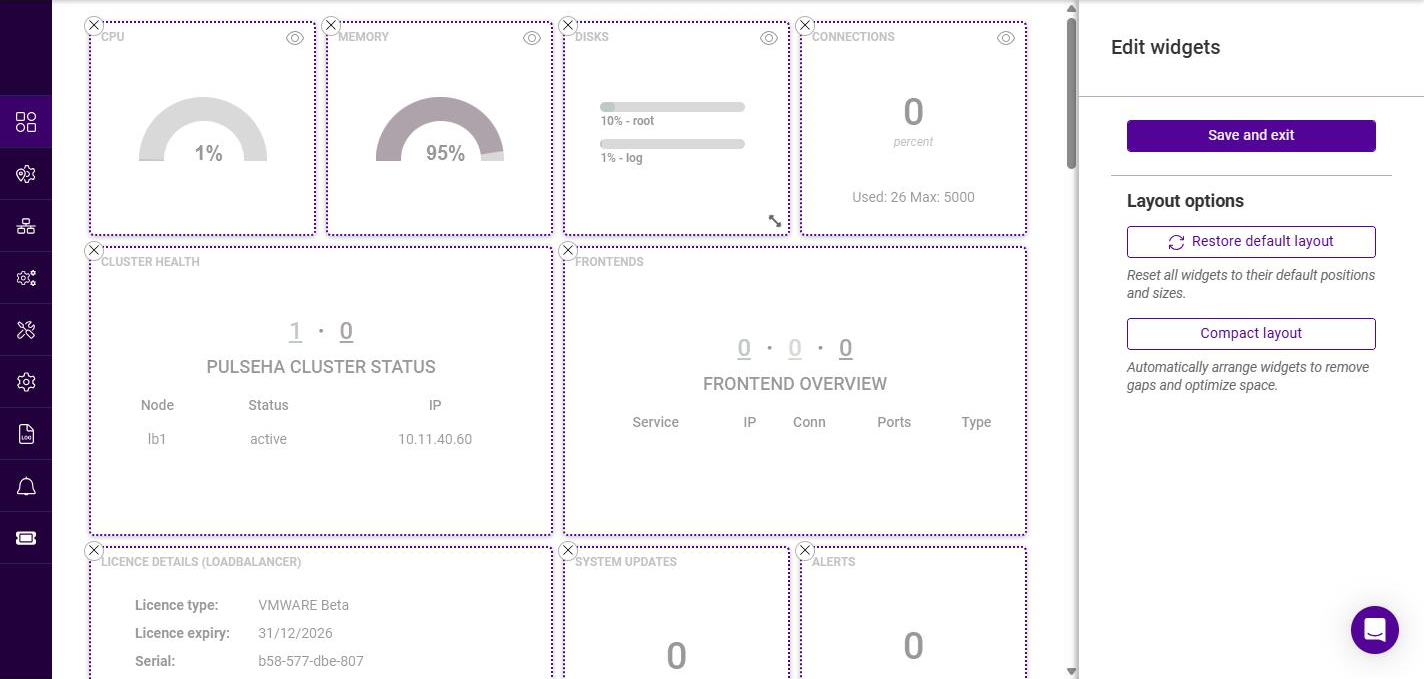
The dashboard layout can be tailored to suit your requirements. Widgets can be repositioned, resized and removed, and the layout can be reset or automatically compacted.
To customize the dashboard:
-
Using the WebUI, navigate to System overview.
-
Click Edit widgets (top-right of the page).
-
Edit the layout as required:
-
To move a widget, drag it to the required position.
-
To resize a widget, drag its bottom-right corner.
-
To remove a widget, click the X in its top-left corner.
-
-
The following Layout options are available in the panel on the right:
Option Description Restore default layout
Resets all widgets to their default positions and sizes.
Compact layout
Automatically arranges the widgets to remove gaps and optimize the use of space.
-
Once the required changes have been made, click Save and exit to save the layout and return to the dashboard.