Diagnostics & troubleshooting
This chapter covers how to investigate a problem with the appliance or with a load balanced service - the service logs and configuration views available, the appliance’s resource utilization graphs, and how to diagnose the most common Virtual Service faults.
Problems can occur for a number of reasons. Typically, these are due to misconfigured Virtual Services or network topology related issues. With high throughput deployments, issues can also occur due to appliance resources being overloaded.
The appliance aggregates the log output from all of its services into a single, searchable interface, and provides a range of resource utilization graphs. Both are useful when diagnosing issues. The logs are accessed via Network > View logs in the WebUI, where they can be filtered by service, searched using the Search box and refreshed using the Update button. For more information, see View logs.
| Don’t hesitate to contact support if you’re experiencing any issues or need assistance configuring your appliance. |
Service Logs
As described in View logs, Endurance provides comprehensive logs across all system functionality, which can be very useful when diagnosing issues. The Services logs page (Network > View logs) aggregates the log output from every appliance service into a single searchable view - for full details on using this page, see View logs.
When diagnosing a specific problem, filter the display to the relevant service(s):
| Service | Useful for |
|---|---|
IP Virtual Service Director |
Layer 4 health check activity, including when and why Real Servers were marked up or down. |
HAProxy |
Layer 7 service state, reloads and health checks and - if connection logging is enabled - individual client connections. |
PulseHA |
High availability (clustering) and failover events. |
NF Tables |
Firewall (nftables) activity. |
| By default, Layer 7 (HAProxy) logging is set to Off. To enable it, navigate to Settings > Configurations > Layer 7 and set the Log level under Logging to the required level (Healthcheck, Errors or Debug), then click Submit. Note that verbose logging on a busy Virtual Service is likely to rapidly exhaust the available log space. |
View Configuration
As described in View configs, the underlying configuration of all system components and services can easily be viewed. This is often useful when diagnosing an issue, as it shows exactly how a service has been configured.
To view a configuration:
-
Using the WebUI, navigate to Settings > View configs.
-
Select the system component or service you’d like to view, e.g. HAProxy (Layer 7), IP Virtual Service Director (Layer 4) or Conntrack.
-
The related configuration is displayed. Where more than one view is available (for example Database and Config), use the tabs at the top of the page to switch between them. Click Copy output to copy the displayed configuration to the clipboard.
Appliance Resource Utilization
The graphs in the Dashboard can be used to provide a quick overview of appliance resource utilization. The following graphs are provided:
-
Network Graph (kbs) - network throughput, showing the transmit (tx) and receive (rx) rate for each interface
-
System Load Average (%) - the system load average over time
-
System Memory Usage (Mb) - memory usage over time
The graphs can be viewed by navigating to the lower portion of the Dashboard, or by clicking the "eye" icon in the top right corner of the CPU, Memory, Disks or Connections widget at the top of the screen - or of any of the graph widgets themselves. Whichever icon is used, the Dashboard details view opens with that metric pre-selected. For more information, see Viewing Detailed Metrics.
Diagnosing Virtual Service Issues
Virtual Services may not function as expected for a variety of reasons. This section suggests various diagnostic methods that can help identify problems and also looks at potential misconfiguration issues.
Using the Dashboard
The Dashboard can be used to quickly check the state of Layer 4 and Layer 7 Virtual Services and their associated Real Servers.
Start with the Services widget. Its heading counts the configured services by health status - Online (green), Pending (amber) and Failure (magenta) - and a status is only shown when at least one service is in it, so a fully healthy appliance shows a single green figure.
A service whose Real Servers are only partly up is reported differently from either extreme. It is not counted as Online; it appears in the amber Pending figure instead, and its Status on the Manage services page reads N/A. In the example below a single Real Server has failed, so the service is still listed in the Service overview table and is still serving traffic from its healthy Real Server, but it is reported as degraded rather than online.
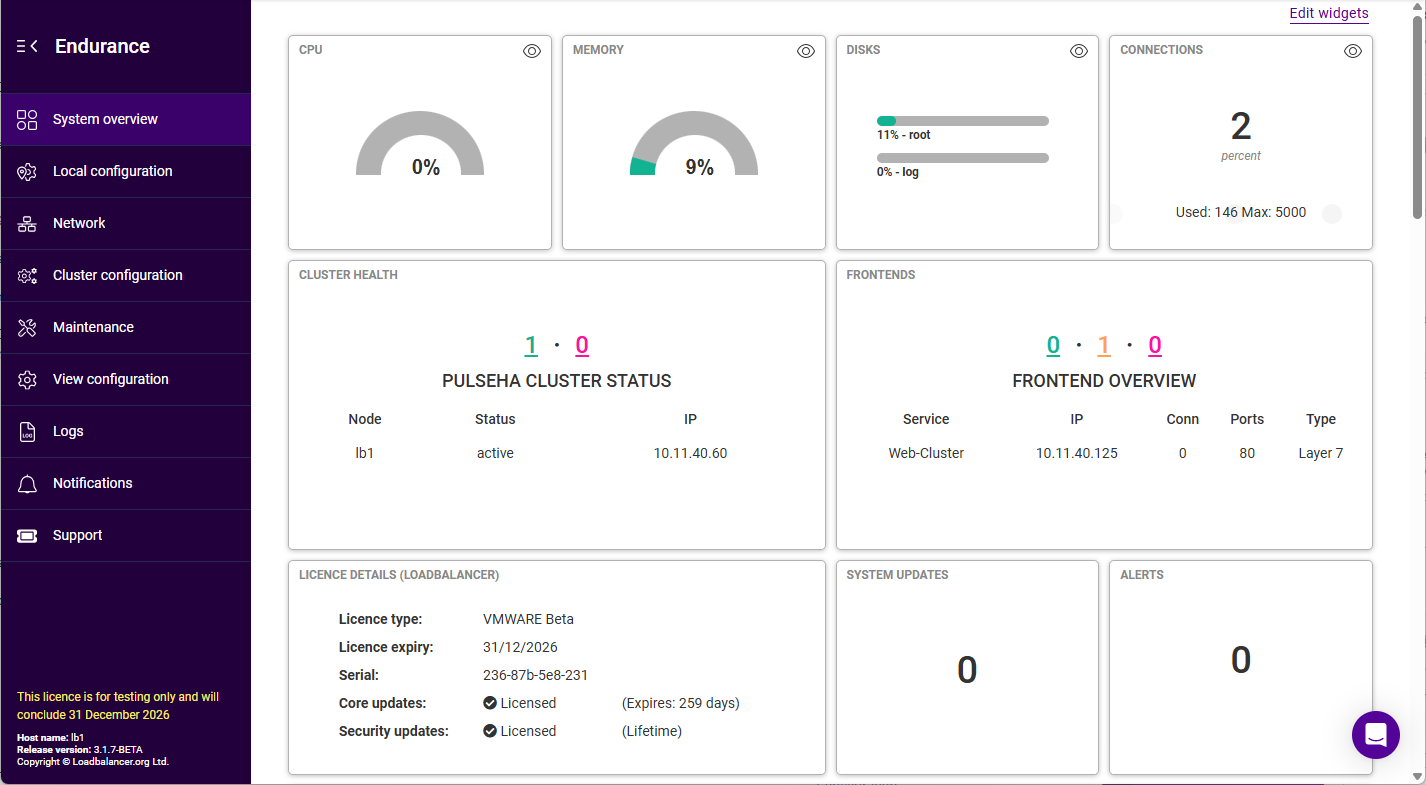
| The Services counts are counts of services, not of Real Servers. A service counted in the amber Pending figure is the signal that something about it is degraded, but the figure never tells you which Real Server is at fault - always open the service to find out. Each count is also a link; clicking it opens the Manage services page. |
-
Click the service name - here Web-Cluster - to open its Service details page.
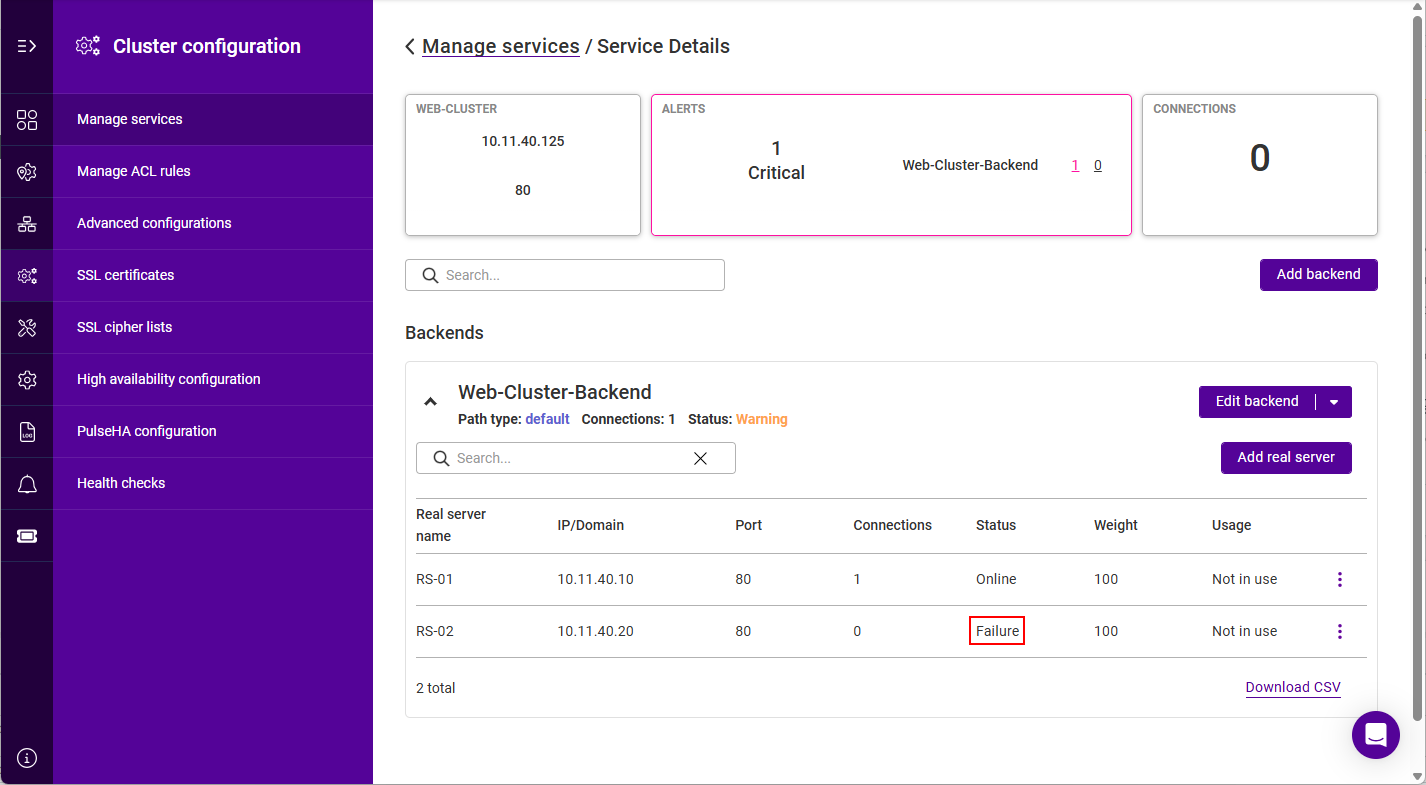
The Alerts tile now reports 1 Critical against Web-Cluster-Backend, the backend’s own Status reads N/a, and the Real Server list shows that RS-02 has a Status of Failure - it is failing its health check. This should be investigated and corrected - possible steps include:
-
Verify that the application/service is running on RS-02.
-
Make sure you can ping the Real Server from the load balancer - either from the console, via an SSH session or using the WebUI menu option: Settings > Terminal command.
If you run ping from the WebUI, use the form:
ping -c 4 10.11.40.20
The -c 4 means ping 4 times then stop. This is important when running the command from the WebUI to ensure it terminates cleanly.
-
Verify that the application/service is up and available when accessed from the load balancer - various methods can be used:
-
Using nmap at the console, via an SSH session or using the WebUI option: Settings > Terminal command:
nmap 10.11.40.20
The following is displayed for a working server:
Starting Nmap 7.92 ( https://nmap.org ) at 2025-08-08 08:20 UTC
Nmap scan report for 10.11.40.20
Host is up (0.00030s latency).
Not shown: 995 filtered tcp ports (no-response)
PORT     STATE SERVICE
80/tcp   open  http
135/tcp  open  msrpc
443/tcp  open  https
445/tcp  open  microsoft-ds
3389/tcp open  ms-wbt-server
MAC Address: 00:50:56:82:0B:D3 (VMware)

Nmap done: 1 IP address (1 host up) scanned in 4.90 seconds
This shows that the server is listening on port 80.
-
Using curl at the console, via an SSH session or using the WebUI option: Settings > Terminal command:
curl http://10.11.40.20
or
curl http://host.mydomain.com
For a working web server listening on port 80, the default page is returned.
-
-
Ensure that access to the Real Server is not blocked by a firewall.
| A Real Server that has been halted from its three dots menu is reported differently from one that has failed its health check. A halted server shows a Status of Maintenance and is reported in the Alerts tile as a Warning rather than a Critical, and the service itself stays Online - both in the Services widget and on the Manage services page. Only a genuine health check failure degrades the service to the amber Pending figure and a Status of N/A. |
VIPs & RIPs are up but Users Can’t Connect
If you’ve configured your VIPs and RIPs and everything looks good (green) in the Dashboard but users still can’t connect, there are a number of potential causes for this as described below.
Layer 4 VIPs
Layer 4 DR mode and DNAT mode have certain configuration requirements. It’s important to remember that the health checks performed by the load balancer verify that the load balancer can successfully access the server/service/application. This does not verify that each server has been configured correctly to enable client access. The following sections explain the configuration requirements for each mode. In both cases, a Real Server that passes its health check (and so appears green in the Dashboard) but to which clients still cannot connect is a strong indicator that these requirements have not been met.
DR Mode
For Layer 4 DR mode VIPs, the "ARP Problem" must be solved on all associated Real Servers - the exact steps required depend on the particular Real Server OS. If the "ARP Problem" has not been correctly solved, the load balancer’s health checks will pass but client connections will fail. For more information, see DR Mode Considerations.
DNAT Mode
For Layer 4 DNAT mode VIPs, the default gateway on all associated Real Servers must be configured to be an IP address on the load balancer to ensure that client return traffic passes back via the load balancer. For a multi-node cluster, this should be a floating IP address to allow the IP address to float (move) between the nodes. If the default gateway is not set correctly, the load balancer’s health checks will pass but client connections will fail.
Layer 7 VIPs
Layer 7 mode - Have you configured the correct Layer 7 mode? The default mode for new Layer 7 VIPs is HTTP mode. This is fine for web based traffic typically on port 80, but if you’ve configured your Layer 7 VIP to load balance something else such as HTTPS on port 443 or RDP on port 3389 then you’ll need to set the Layer 7 mode to TCP mode.
TProxy - If you’ve enabled transparent proxy (TProxy) so that the Real Servers see the original client source IP address, the Real Servers must route their return traffic back via the load balancer - typically by setting their default gateway to a Floating IP owned by the load balancer. For more information on the Enable TProxy option, see Backend Configuration - Layer 7 advanced.
Multi-port VIPs
Does your VIP listen on multiple ports, for example 80 and 443? The appliance handles this for you: as soon as a frontend has more than one port the wizard disables the Real server port field, and the Real Server is stored with a port of N/A so that each connection is passed through on the port the client connected to. The field still shows 80 while disabled - that value is not used.
Because the Real Servers then have no port of their own, the backend must be given one to health check against. If it is not, the wizard refuses to submit with:
Backend <name>: The health check port must be set as there are RIPS that do not have ports set,
assigned to this backend
Set Health check port on the backend’s Health step to the port that should be checked, for example 80.
| Port translation is not possible in DR mode, so for a Layer 4 Direct Routing service traffic is always passed through to the same port as received by the VIP regardless of what the Real server port field contains. For a single-port frontend the wizard still displays the field - pre-filled with 80 - when Direct Routing is selected, but its value has no effect. |
Requests are not Load Balanced as Expected
If the Dashboard reports that there is an imbalance in the number of connections, this may be caused by a number of reasons as listed below:
Are clients connecting from behind a NAT device? - If this is the case, then all requests will appear to come from the same source IP address. This will be an issue if source IP address persistence is used because all client sessions would be load balanced to the same Real Server.
Has a real server been brought back online? - If Balance mode has been set to Weighted Least Connection (Layer 4) or Weighted Least Connected (Layer 7), when the server is brought online it will handle all new requests until balance is reached across all servers. This may occur quickly if lots of new requests are received. If not, the imbalance will continue for longer. If Balance mode has been set to Weighted Round Robin, requests will continue to be distributed equally (assuming the weight is the same). If the other Real Servers in the cluster were already processing requests there will again be an imbalance.
Are you testing using a single test client? - If persistence is enabled for the VIP then you’ll be load balanced to the same Real Server.
Useful Tools & Utilities
Useful Diagnostics Tools
The appliance includes a number of useful diagnostics tools that can be run at the console or via an SSH session. Most commands can also be run via the WebUI - to run commands via the WebUI, see Execute shell command.
Ss
netstat is not installed on an Endurance appliance - the ss command from the iproute2 package
replaces it. It prints socket statistics and is useful to check that services are listening on the
expected IP address and port. Common options are -l (listening sockets only), -n (numeric, do not
resolve names), -t (TCP), -u (UDP) and -p (show the owning process).
e.g. ss -lntp
Command Output:
State   Recv-Q  Send-Q   Local Address:Port   Peer Address:Port  Process
LISTEN  0       4096       10.11.40.70:9083         0.0.0.0:*      users:(("pulseha",pid=907,fd=7))
LISTEN  0       4096         127.0.0.1:199          0.0.0.0:*      users:(("snmpd",pid=602833,fd=9))
LISTEN  0       128        10.11.40.70:22           0.0.0.0:*      users:(("sshd",pid=916,fd=7))
LISTEN  0       511        10.11.40.70:443          0.0.0.0:*      users:(("nginx",pid=1105,fd=5))
Use -u in place of -t for UDP sockets, for example ss -lnup to confirm that the SNMP agent is
listening on port 161.
Packet Captures
tcpdump is not installed on an Endurance appliance. If a packet capture is needed to diagnose a
network problem, please contact our support team, who will advise on the best way
to collect one for your deployment.
Ethtool
Ethtool is used for querying settings of an Ethernet device and changing them. Endurance uses predictable interface names such as enp1s0, not eth0 - run ls /sys/class/net to list the interfaces present.
e.g. ethtool enp1s0
Command output:
Settings for enp1s0:
        Supported ports: [  ]
        Supported link modes:   Not reported
        Supported pause frame use: No
        Supports auto-negotiation: No
        Advertised link modes:  Not reported
        Advertised pause frame use: No
        Advertised auto-negotiation: No
        Speed: Unknown!
        Duplex: Unknown! (255)
        Auto-negotiation: off
        Port: Other
        PHYAD: 0
        Transceiver: internal
        Link detected: yes
Nmap
Nmap (Network Mapper) can be used to scan a range of hosts or a single host to determine which ports are open and which services are listening on those ports. It is useful for checking that a Real Server is listening on the port a Virtual Service expects.
e.g. nmap 10.11.40.20
A worked example, including the output for a healthy Real Server, is given in Diagnosing Virtual Service Issues.
Wireshark
Wireshark is an open source application that can be used to analyze tcpdump output files. It can be downloaded from here.
Windows Specific Tools
Microsoft Network Monitor
Network Monitor is a simpler alternative to Wireshark that has some nice features. It can be downloaded from here.
WinSCP
WinSCP is an open source application that allows files to be uploaded/downloaded to/from the load balancer using Windows. It can be downloaded from here.
PuTTy
PuTTy is an open source SSH client for Windows. It can be downloaded from here.