Viewing & Modifying the Configuration
Once created, the service can be viewed and edited using the WebUI.
Viewing the Service Using the System Overview
-
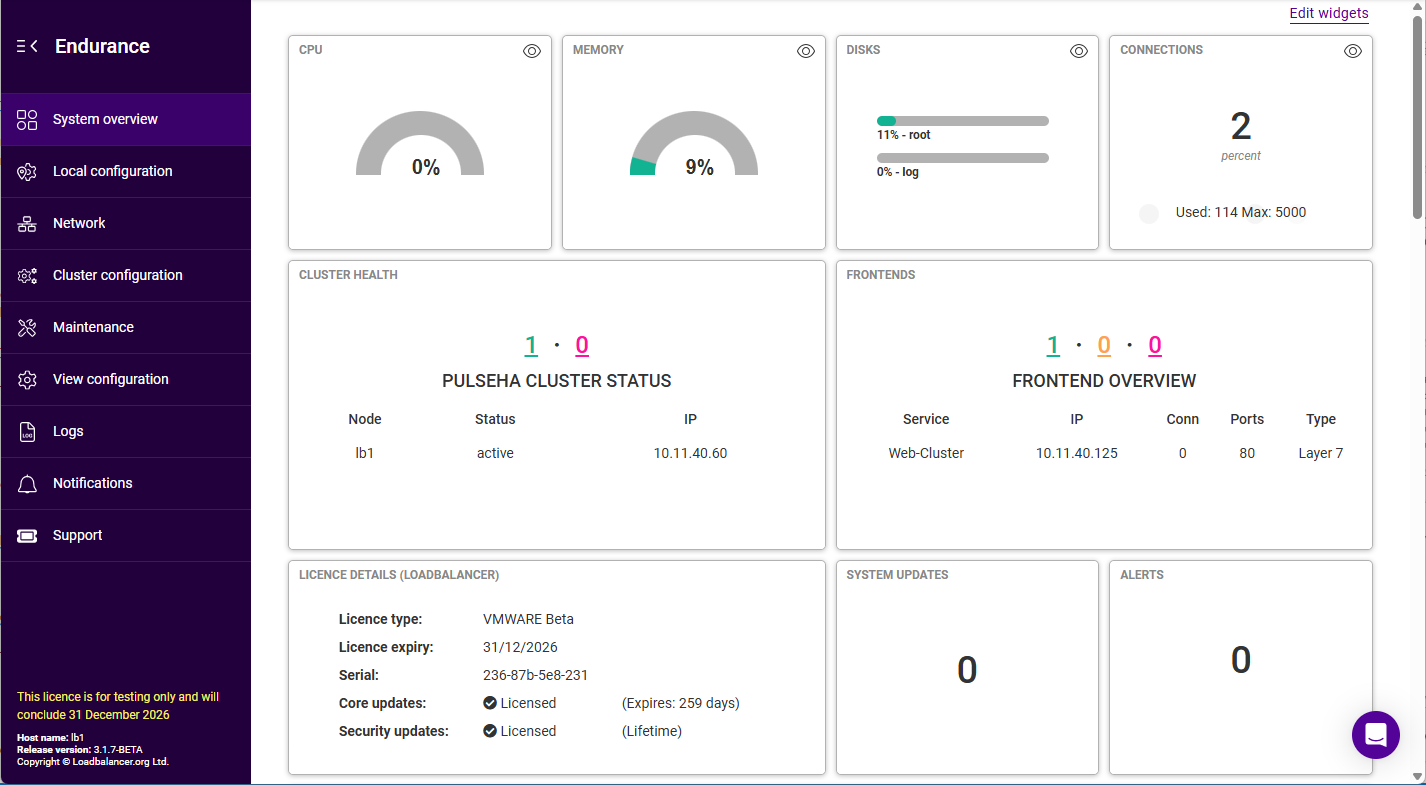
In the WebUI, click System Overview.
-
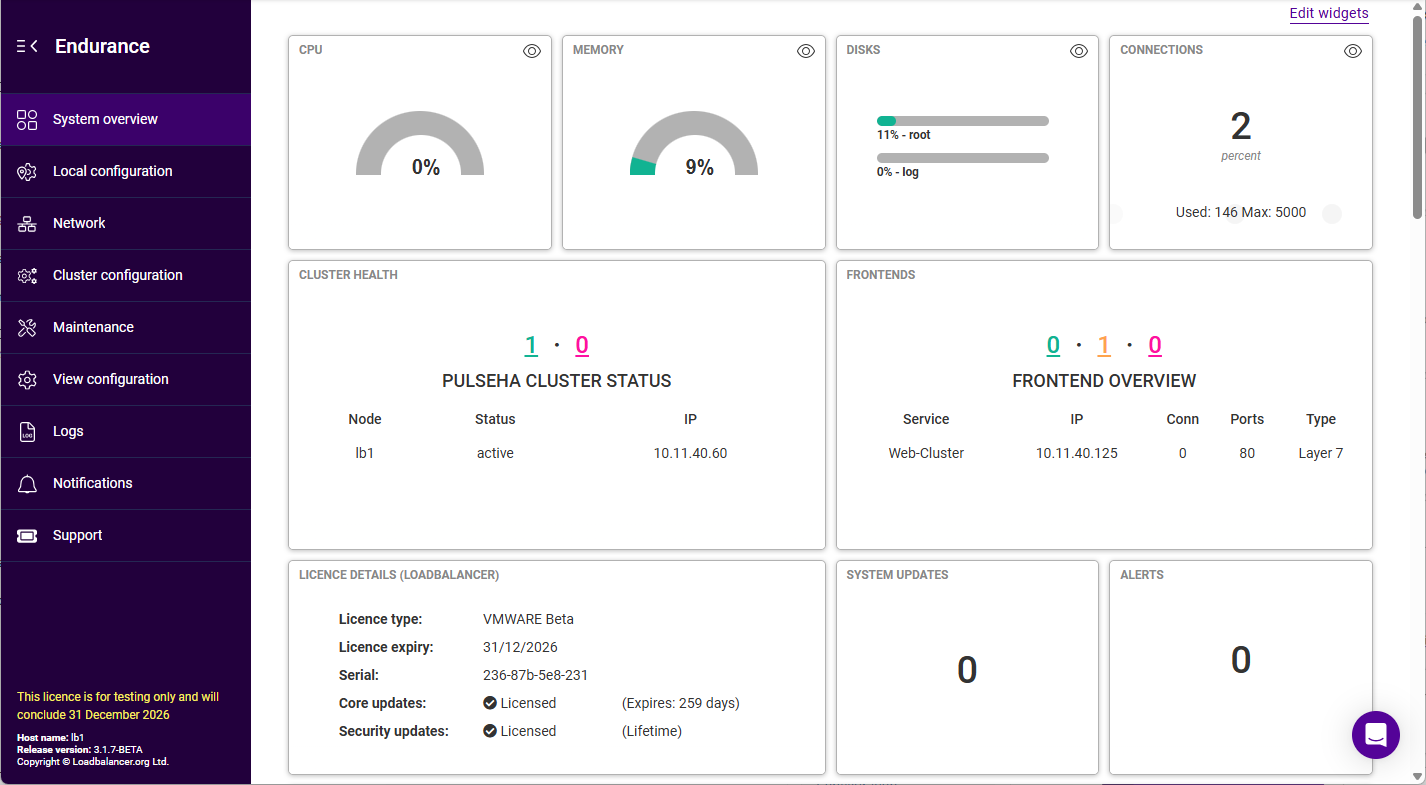
The FRONTENDS widget shows the Web-Cluster service.
-
The colors indicate the status of all services, in this case only Web-Cluster has been added, it’s healthy so "1" (i.e. one service) is displayed green.
-
Modifying the Service
Frontend
-
Navigate to Cluster Configuration > Manage services.
-
Click the three dots menu next to the service to be modified and select Edit.
-
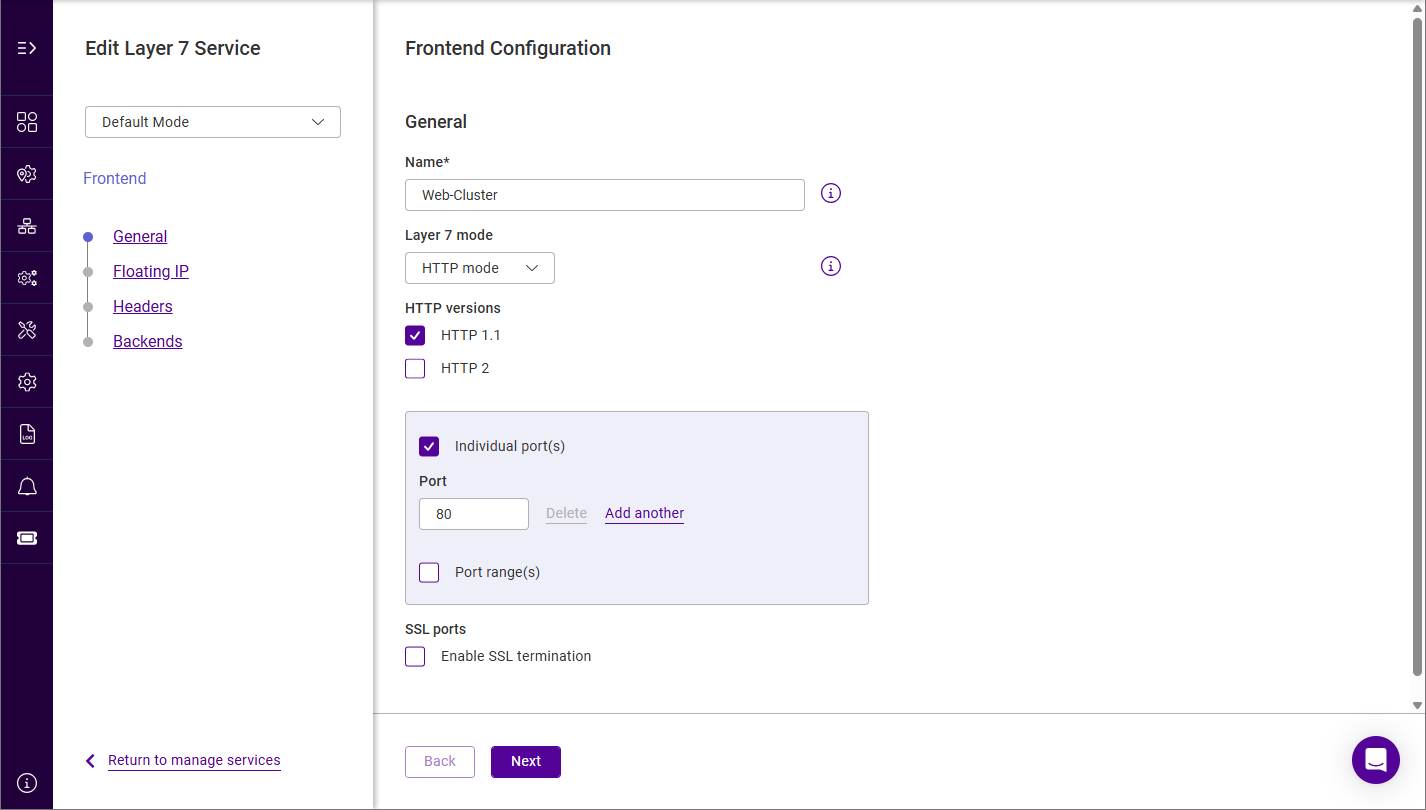
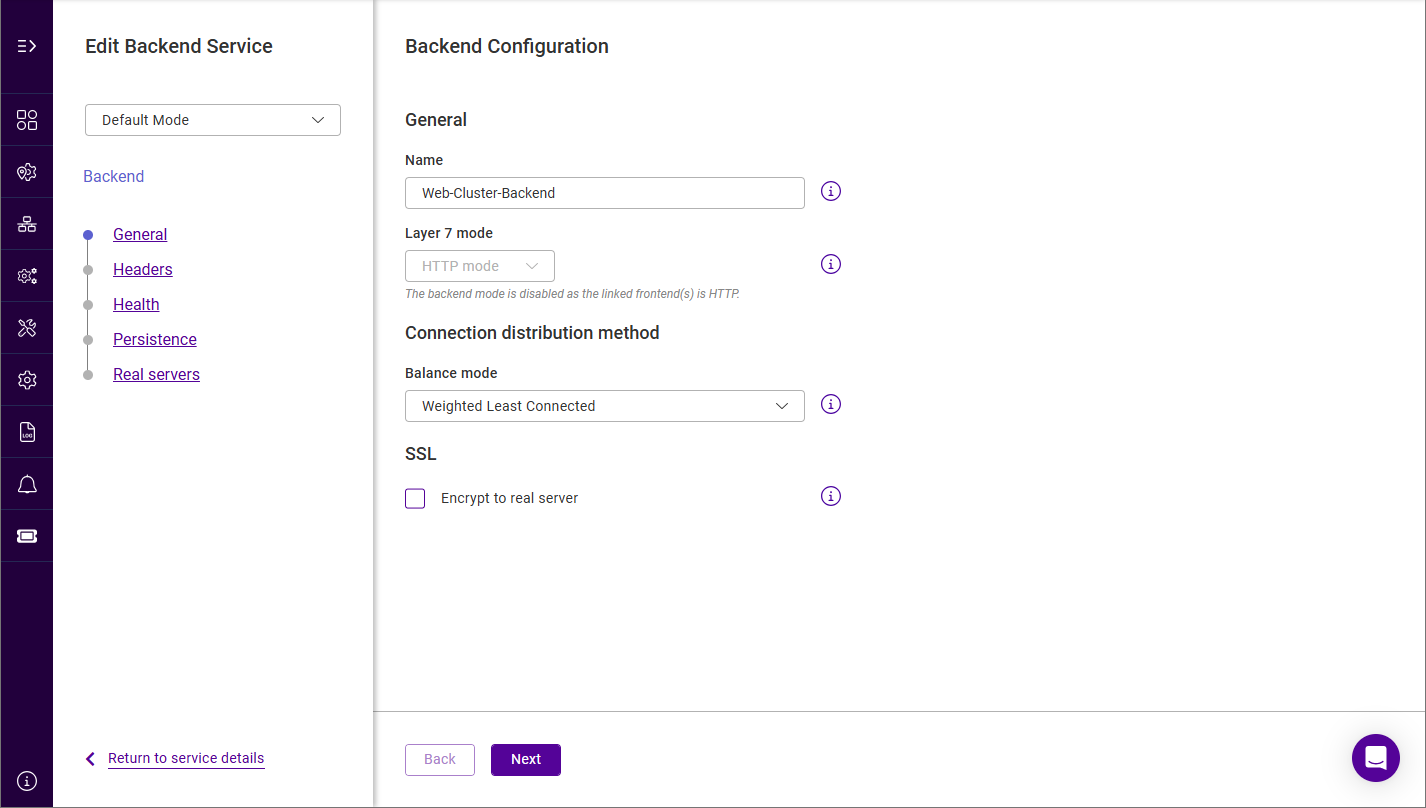
Select the section to be modified In the area to the left, make the changes required, click Next to step through the remaining sections, then click Submit to save the changes.
Verification & Testing
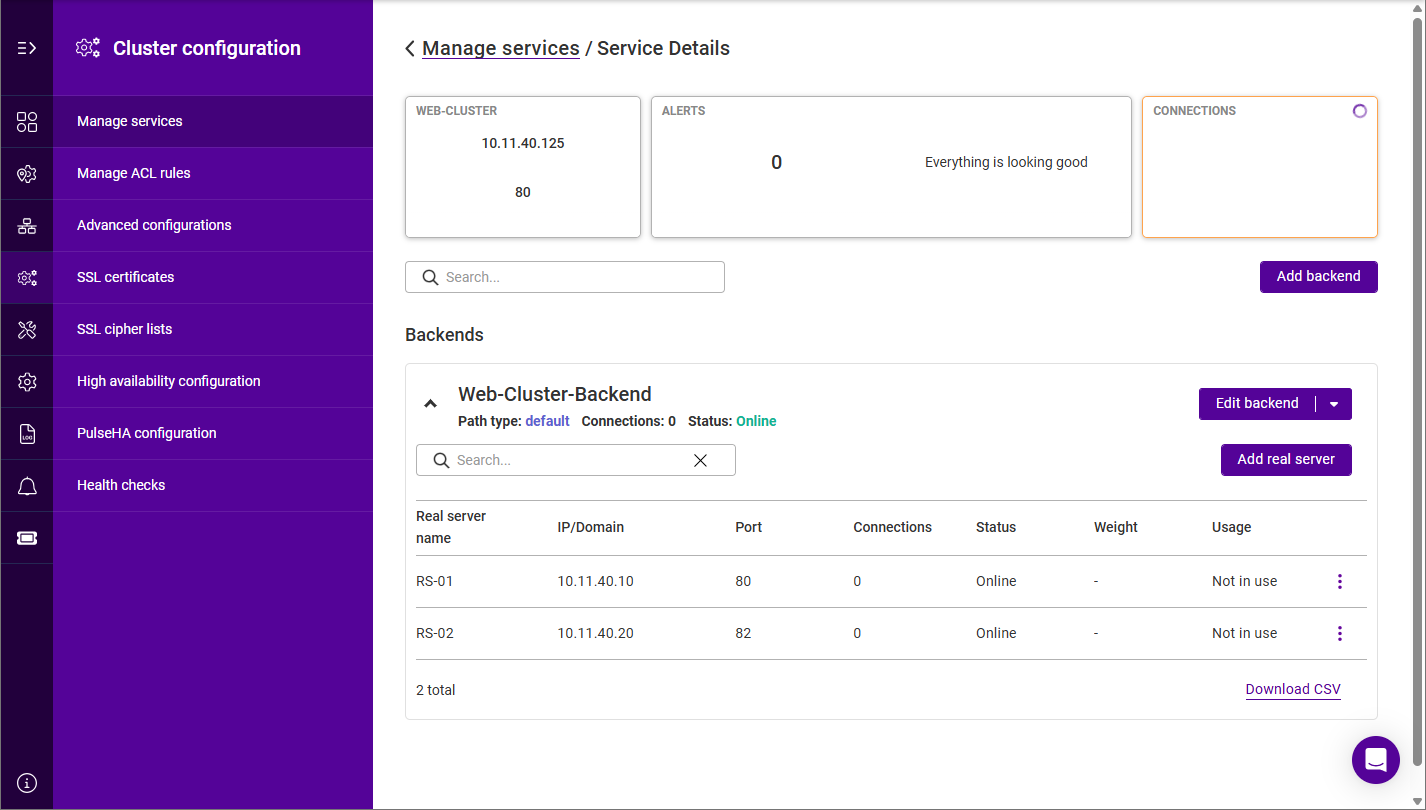
Verify that both Real Servers are up. In the example below, the orange "1" indicates that one of the Real Servers associated with Web-Cluster has failed its health check.
-
Click into the Web-Cluster service.
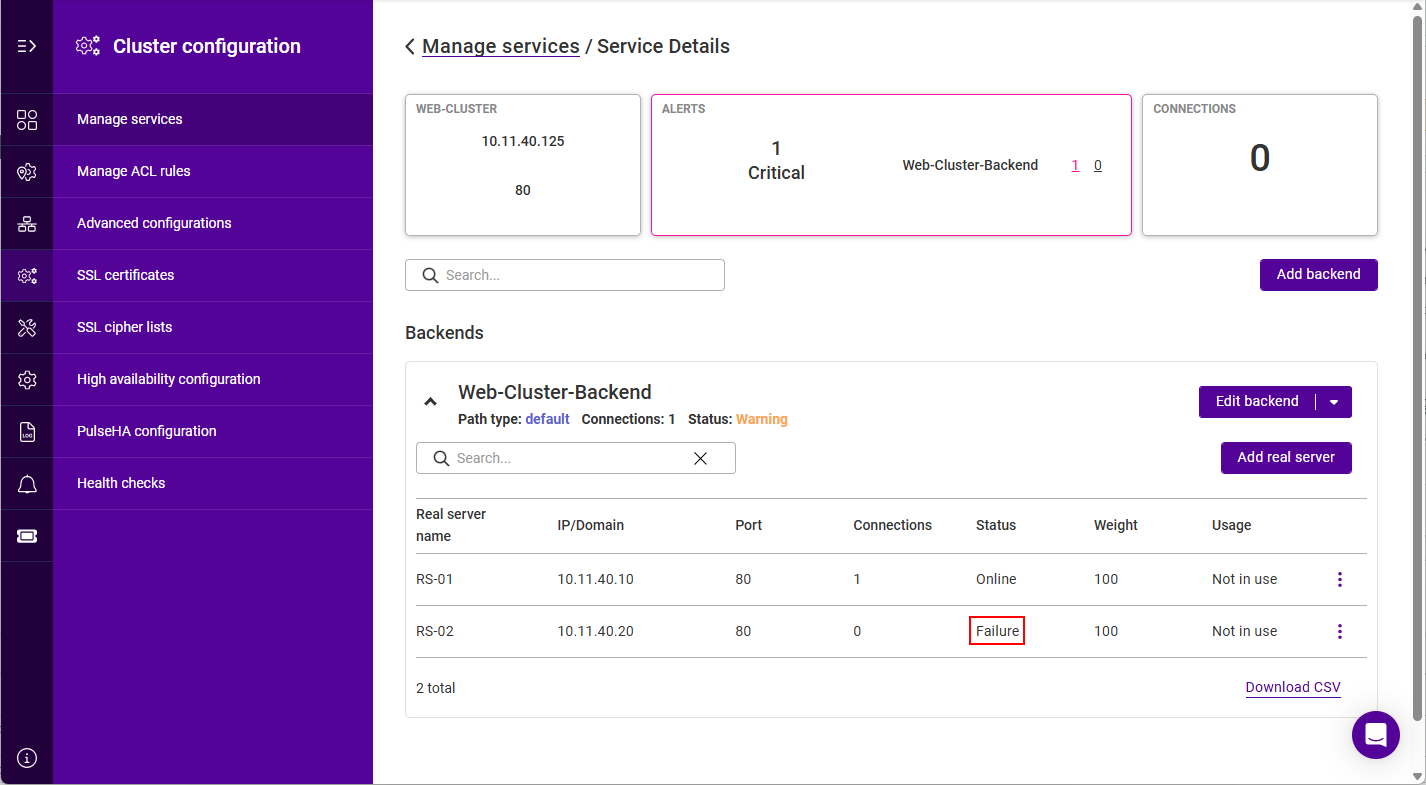
The image above shows that RS-02 is failing its health check, this should be investigated and corrected - possible steps include:
-
Verify that the application/service is running on RS-02.
-
Make sure you can ping the Real Server from the load balancer - either from the console, via an SSH session or using the WebUI menu option: Local Configuration > Execute shell command.
If you run ping from the WebUI, use the form:
ping -c 4 10.11.40.20
The -c 3 means ping 3 times then stop.
-
Verify that the application/service is up and available when accessed from the load balancer - various methods can be used:
-
Using nmap at the console, via an SSH session or using the WebUI option: Local Configuration > Execute Shell Command:
nmap 10.11.40.20
The following is displayed for a working server:
Starting Nmap 7.92 ( https://nmap.org ) at 2025-08-08 08:20 UTC
Nmap scan report for 10.11.40.20
Host is up (0.00030s latency).
Not shown: 995 filtered tcp ports (no-response)
PORT     STATE SERVICE
80/tcp   open  http
135/tcp  open  msrpc
443/tcp  open  https
445/tcp  open  microsoft-ds
3389/tcp open  ms-wbt-server
MAC Address: 00:50:56:82:0B:D3 (VMware)

Nmap done: 1 IP address (1 host up) scanned in 4.90 seconds
This shows that the server is listening on port 80.
-
Using curl at the console, via an SSH session or using the WebUI option: Local Configuration > Execute Shell Command:
curl http://10.11.40.20
or
curl http://host.mydomain.com
For a working web server listening on port 80, the default page is returned.
-
-
Ensure that access to the Real Server is not blocked by a firewall.
Once both servers are up, browse to the FIP/Service address and verify that you see the web page from each Real Server:
-
Halt RS-01 using the three dots menu next to the Real Server and verify that content is served by RS-02 on a browser refresh.
-
Bring RS-01 back online, then halt RS-02 and verify that content is served by RS-01 on a browser refresh.